April 16, 2013, San Francisco
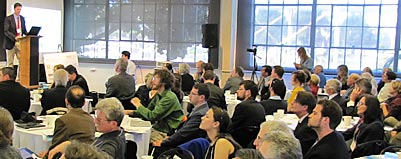
Stanford Professor Mark Jacobson spoke at the Pathways to 100% Renewable Energy Conference at Fort Mason in San Francisco on the technical and economic feasibility of a 100% renewable energy world by 2050 – without relying on nuclear power. His presentation was part of the second panel discussion: Overcoming Technical Barriers to 100% Renewable Energy in the Power Sector.
Jacobson’s approach includes large new deployments of wind and solar power, and benefits from dramatic energy efficiency gains made possible by changing the energy infrastructure to electricity and electrolytic hydrogen and away from less efficient fossil fuels.
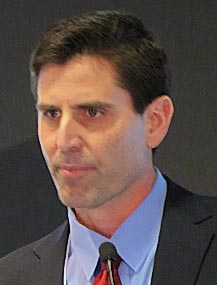
“In the US, there is a 37% reduction in power demand just by converting the energy infrastructure … just by changing the infrastructure to electricity and electrolytic hydrogen”
Transcription of Mark Jacobson’s talk:
“So I’d like to talk today about these plans we’ve been developing for the world, the US, and individual states, to repower them with 100% wind, water, and solar power.”
“From our perspective, we’re looking at it not only from a climate and energy security, but also an air pollution, point of view. Worldwide, there are two and a half to 3 million people die every year prematurely from air pollution. In fact, in the last 100 years over 100 million people have died prematurely from the fossil fuel industry pollution.”
“In addition, Arctic sea ice is disappearing due to global warming. Temperatures are rising fast, and the Arctic is expected to disappear within 10 to 20 years entirely, at least the summer sea ice, and possibly year-round sea ice.”
“Higher population and increasing energy demand is causing energy shortages already in some places, and that’s leading to higher prices, and so, these are drastic problems and they require drastic solutions.”
“So we did an evaluation a few years ago looking at well, what are the cleanest energy technologies, not only in terms of global warming, air pollution, energy security, and also in terms of land-use, and water supply, and catastrophic risk, and we came up with a ranking that wind, concentrated solar, and geothermal, tidal power, photovoltaic cell wave power and hydroelectricity were the best electricity options, and these energy technologies powering battery electric vehicles and hydrogen fuel-cell vehicles to some extent, were the best for transportation.”

“We did not recommend nuclear or coal with carbon capture, natural gas, or biomass for most purposes. Liquid biofuels, because of air pollution impacts were not recommended, regardless of the type, corn or cellulosic or sugarcane ethanol or biodiesel’s because of their air pollution in particular, or compressed natural gas. So we called the recommended technologies ‘wind, water, and solar power’ and in 2009 we developed this plan to repower the entire world’s energy infrastructure from a technical and economic point of view.”
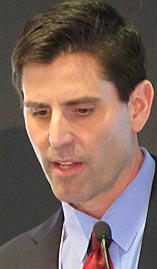
“These are drastic problems and they require drastic solutions” ~ Mark Jacobson
“And one of the interesting things that we found was, if we look at the end use power demand worldwide in 2010, it was about 12 1/2 terawatts of end use energy for all purposes including electricity, transportation, heating and cooling, and industrial processes. Well that would go up to about 17 terawatts in 2030 based on EIA projections, but if we convert everything to electricity and some electrolytic hydrogen for all purposes, then our power demand actually goes down about 32% worldwide due to the efficiency of electricity versus internal combustion. And this is before actual energy efficiency measures come in to play. So part of the plan is converting that resulting 11 1/2 terawatts into clean energy, and then we can actually reduce that further with energy efficiency measures.”
“In the US, there is a 37% reduction in power demand just by converting the energy infrastructure, and again, that’s without even changing your habits, just by changing the infrastructure to electricity and electrolytic hydrogen. For California, it’s a 44% reduction, and that’s because, with the transportation is where you get the greatest improvements, a reduction of energy requirements by converting, for example, from gasoline vehicles to battery electric vehicles, because of the efficiency of batteries versus internal combustion.”
“So let’s just look a little bit at some of the numbers, well how many different wind, water, and solar devices do you need to power the world? And we looked at 50% would be from wind power, 40% solar, and 10% everything else. And the 50% wind is about 3.8 million five megawatt wind turbines, which might sound like a lot, but keep in mind that we produce 70 million cars every year, and this is a one-time production for at least 30 years, and the US are produced 330,000 airplanes in five years during world war two, and the world produced about 750,000 airplanes during the same period. So we don’t think it’s a large number. The solar would be rooftop solar, actually only 6% of the total world demand would be supplied by that. 14% would be solar PV plants, 20% CSP plants, and then 4% hydroelectric which almost all of that exists, or most of that exists already, and 4% geothermal, 1% wave and tidal.”
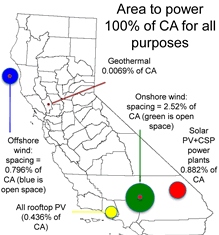 “For California, we’re looking at a slightly different energy mix, it’s more solar than wind, but it’s still 25% onshore wind, 10% offshore wind, 10% rooftop PV systems, 15% government commercial rooftop PV systems, 15% solar PV plants, 15% CSP plants, 5% geothermal, 4% Hydro of which 90% is in place and you don’t need new dams to get the rest actually, they can be on existing dams that don’t generate electricity, or more efficient use of existing dams. Half a percent of tidal and half percent wave. And this is to repower all of California for all purposes, so you can get rid of every nuclear plant, all oil all gas all coal, all in fact biofuels.”
“And this is the land area that would be needed and water area to repower the entire state for all purposes. The blue is offshore wind, the red dot is that footprint on the water, the green is onshore wind, and really it’s open space that can be used for multiple purposes, including ranch land grazing land agricultural land or open space, and just the red dot in center is the actual footprint on the ground. The red circle is solar PV and CSP power plants, the yellow is rooftop solar that would go on existing roofs, and geothermal is a small dot there. So these land areas are not large.”
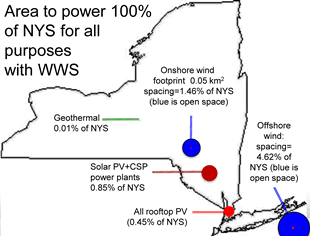 “If we look at New York State, we also did a plan for New York State that was published about three weeks ago, looking at repowering the state for all purposes with wind, water, and solar. In that case there’s more 40% offshore wind, 10% onshore wind, and 35% solar, and here are the areas. They’re not large areas that are required to repower the state, and that’s also before you even account for removing the existing energy infrastructure.”
“In terms of resources available, we do mapping of solar and wind resources on a worldwide and regional scale, and we found that there are about 340 terawatts of solar worldwide in high solar locations. That’s about 30 times the world power demand for all purposes that you would need with electricity and hydrogen, electrolytic hydrogen of eleven and a half terawatts. So there’s plenty of solar worldwide to repower the world’s energy infrastructure.”
“With wind, there’s about 6 to 7 times more wind available onshore or near shore at high wind locations worldwide, and including in the US, offshore of the East Coast, the Great Plains, offshore of the West Coast even though there’s deeper water there, are some examples.”
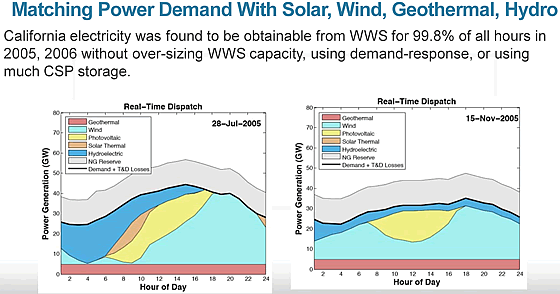
“Now for reliability, we’ve done studies looking at, well, can we combine wind, and solar, and geothermal hydroelectric to match the power demand. And we did a study for California, every hour of two years, 2005 and 6, so the black line in these figures – these are two particular days – the black line is the power demand on those days, and underneath the kind of orangish red is geothermal which is base load, the light blue is wind, which is at six locations, including one offshore site, and the rest are existing onshore sites, and these are actual wind data from those sites. The yellow is solar PV, the orange would be concentrated solar, so the only thing we really increased for California was the penetration wind and solar from theoretical calculations using the observed solar and wind resources. And the blue is existing hydroelectric, we did not increase that. And we were able to match the power demand with these resources without even using demand response electric vehicles, without oversizing the grid to make it easier to match the power demand on 99.8% of the hours over two years with existing resources. And the rest, the 0.2% was used, was satisfied with natural gas in this case, which is the gray, which is just sitting as spinning reserves, and was not actually used except for 0.2% of the hours.”
“But then, you know, if you add these other things like demand response, some actual storage, and batteries, or flywheels, or something else, or you oversized the grid, because we want to power not only electricity but transportation, heating, and cooling. You oversize it to make it easier to match the power on the grid, and then you dump the excess electricity into producing district heat like they do in Denmark, or for producing the hydrogen that we need. It turns out that this is not rocket science, it’s just an optimization problem to do this.”
“In terms of cost, these are the real cost of energy. Onshore wind is 4 to 10 1/2 cents a kilowatt hour, it’s cheaper than natural gas in the Great Plains, you can get it down in fact to three cents a kilowatt hour. I’ll give you a statistic to prove that. The second geothermal is competitive right now, hydroelectric. And, fossil fuels are 9.70 cents a kilowatt hour on average for electricity, plus another 5.3 cents for externality costs. That makes about 15 cents a kilowatt hour and they’re projected to go up to18 to 21 cents a kilowatt hour in 2020 to 30 whereas all the clean energy technology price are coming down.”
“If you take the five states in the US with the highest penetration of wind as a fraction of their grid, which are South Dakota, Iowa, North Dakota, Minnesota, and Wyoming, the average price of electricity in those states went up 2 cents a kilowatt hour between 2003 and 2011. If you look at all the rest of the states it went up 3.6 cents a kilowatt hour. In Hawaii, which has only about 3% clean energy on the island, it went up $.17 a kilowatt hour.”
“So, you have to wonder, well, why is the price electricity going up the lowest in the states with the most wind, the highest penetration of wind. In South Dakota, it’s up to 25% of its electric power is now from wind. And so the reason is because fossil fuel prices are variable, whereas the fuel cost of wind, water, and solar is zero – it’s just the capital cost.”
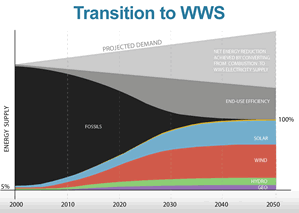
“And so this is kind of a transition, how we transition to 100% clean energy by 2050 and it’s maybe hard to read, but the upper triangle shows, just by converting to electricity and hydrogen, that gives you the 30, well this is that of a generic graph for the US, so it’s about a 37% reduction in power demand, just by converting to electricity and hydrogen. And then there’s another, the next item down there, is end-use efficiency improvements where you can reduce the power demand even further, and the rest would be powered by wind, water, and solar technologies. So hopefully by 2050 we’d eliminate everything. By 2030 it would be an 80% plus reduction.”
“Just to summarize everything, if we convert to wind, water, and solar, plus electricity to hydrogen, we’d reduce our world power demand by 32%. We’d eliminate after 2 1/2 to 3 million premature mortalities worldwide each year.”
“The pollution cost savings. If we take the state of New York, we calculated 4000 premature mortalities, that’s equivalent to $32 billion of health costs to the state and other externality costs. That’s 3% of the GDP. In California there’s 16,000 per year and that’s 7% of the GDP of the state.”
“The areas we’d require on the worldwide scale only 0.4% more of the world’s land for footprint and 0.6% for spacing. There are many methods of addressing the variability of wind, water, and solar. We found that there are no material limits, but recycling may be needed. There are barriers such as upfront costs, and transmission needs. But more importantly it’s not a technical or economic problem, it’s more of a social and political problem.”
“If you want more information on these plans, here’s a website, and you can also join the solutions project, which is trying to help solve these problems. There’s a website there.”
“Thank you very much.”
————–
Report by James George
